Investigation Measuring Electromagnetic Disturbance Using Amplitude-Probability Distribution (APD)
Past studies have clarified the relationship between APD measurement of disturbance and degradation in communication quality in affected wireless digital communication systems (PHS, PDC, WCDMA). To help protect digital wireless communications and broadcasting services from electromagnetic disturbance and to promote a stable environment for radio-wave use, we have reported on the results of our research as a standard proposal to the International Special Committee on Radio Interference (CISPR), in addition to contributions to international standardization aimed at establishing techniques to measure electromagnetic disturbance. In 2005 and 2006, international standards were established setting forth the specifications of APD instruments to measure electromagnetic disturbance and stipulating methods of measurement when using these devices.
Relationship Between APD of Disturbance and Quality Degradation in Affected Wireless Digital Communication System
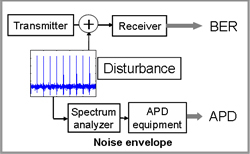
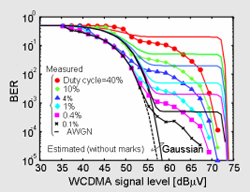
Based on the results of APD measurement of disturbance, degrees of degradation in communication quality in affected digital wireless communication systems caused by interference have been predicted and are presented below. The figure on the left shows a simplified configuration of the experimental system, and the figure on the right shows the BER (bit error rate) values (lines with markers) and estimated BER values predicted from APD measurement. Here estimation is made for worst-case scenarios, and so the estimated BER values are generally higher than those actually measured.
Problem of Internal Interference by Noise Generated Inside a Wireless Communication Terminal Device
Electromagnetic disturbance generated inside wireless communication devices such as mobile phones and PDAs may degrade communication quality from within the device itself. However, the unwanted electromagnetic emissions generated inside devices are generally extremely weak, posing difficulties in measurement. Accordingly, we are currently investigating the use of APD measurement, which includes time probability information for the disturbance envelope.
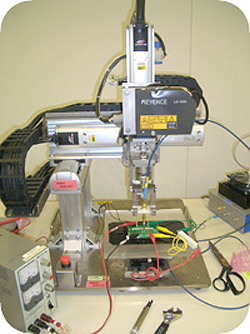
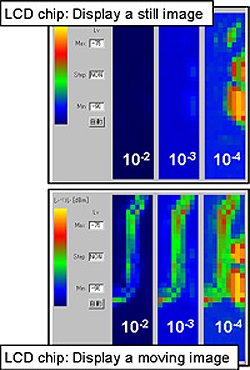
The figure on the left above shows how APD measurements are taken at each point by 2-D scanning on an LCD control module inside a mobile phone. Using the results of APD measurement taken at each point, the probability of amplitude is calculated and the electromagnetic intensity at which this probability becomes 10-2, 10-3, and 10-4 are mapped in color (see figure on right). The plots at the top and bottom show the results of measurement when still and moving images are displayed on the LCD, respectively (courtesy of Taiyo Yuden, Co. Ltd.). It can be seen from the figure that there are clear differences in the properties of electromagnetic emissions released when displaying still and video images.
![]()
- EMC Measurement
- Telecom System EMC
- Studies on Compatibility Between Ultra-Wideband (UWB) Wireless System and Existing Wireless Systems
- Investigation Measuring Electromagnetic Disturbance Using Amplitude-Probability Distribution (APD)
- Modeling of Electromagnetic Noise from Electronic Devices and Electrical Appliances and Investigation of Mechanisms of Interference
- List of Publications
Contact us
4-2-1 Nukui-Kitamachi, Koganei, Tokyo 184-8795, Japan
National Institute of Information and Communications Technology
Electromagnetic Compatibility Laboratory, Applied Electromagnetic Research Institute
![]()